![]()
Q4 2014 NEWSLETTER
Q4 2014 NEWSLETTER
As we enter the last quarter of 2014, we write to summarize market performance since the start of the year and to share our thoughts on positioning portfolios given market turbulence arising from recent geopolitical events. We’ll also share three principles that have led to solid performance in the past, which stand at the core of our approach.
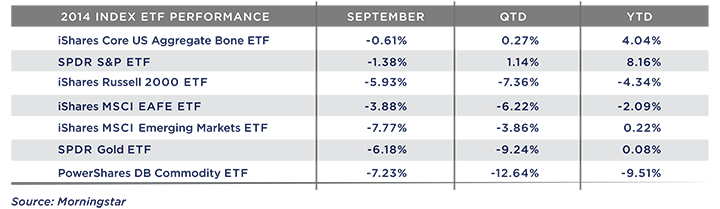
Despite turbulence in the last half of September, U.S. markets continued to build upon the very positive returns of 2012 and 2013. This performance was driven predominantly by large companies. Smaller companies and other regions of the world struggled to maintain the positive momentum of the past few years.
This performance came amidst headlines dominated by big-picture economic and political uncertainty:
- The Ebola epidemic threatening parts of West Africa and surfacing in Dallas, TX
- The resurgent movement of militants in Iraq and Syria
- The Russian leadership and political tensions in the Ukraine
- Concerns about slowing growth in China, with particular focus in the last couple of weeks on political unrest in Hong Kong
- The continued struggles in much of Europe to achieve sustained growth, with high unemployment continuing to pose challenges
Given this uncertainty, we feel it wise to review a few principles that guide our approach to constructing portfolios.
PRINCIPLE ONE
NO ONE CAN PREDICT SHORT TERM MARKET MOVEMENTS
Since the advent of financial news networks, a cottage industry has sprung up of pundits forecasting the direction of markets in the next three, six and twelve months.
Anyone who claims they can predict short term market movements is either kidding themselves or kidding you. The evidence on this is clear-cut—a comprehensive study by Vanguard on forecasting stock returns. This study examined 15 popular measures used to forecast returns and found that none of them had any meaningful predictive power for the next twelve months.
So called market experts are notoriously bad at predicting market returns (see this). Barry Ritholtz, a noted market observer who comments frequently on the folly of forecasting, states: “The bottom line is that humans are terrible at forecasting the future. We are bad at predicting the economy and terrible at forecasting markets. The data shows we can’t even predict our own behavior… Regardless, many people and more than a few investors seem wedded to the idea that the way to make money is to look into your crystal ball, see what comes next and invest accordingly.” In late 1999 the masses were convinced that a wave of technology justified incredibly bloated valuations. In 2009, we feared that the end was near and laughed at the few bold enough to suggest it might be a good time to buy. Today it is preposterous to suggest that we have a clear picture of what the next five years will bring.
PRINCIPLE TWO
VOLATILITY IS NORMAL, AND HEALTHY
It’s been almost 900 days since the US market has experienced a correction—that is a decline of 10 percent or more. As Ron Chernow, author of The House of Morgan, states: “Stock market corrections, although painful at the time, are actually a very healthy part of the whole mechanism, because there are always speculative excesses that develop, particularly during a long bull market.” Not only do corrections clear some of the froth from markets, they can also create opportunities as greed turns to fear. We’ve had an almost uninterrupted run from the March 2009 lows to the recent September S&P 500 highs (nearly a 200% run up in the index). Perhaps there is some exuberance that could stand to be cleared.
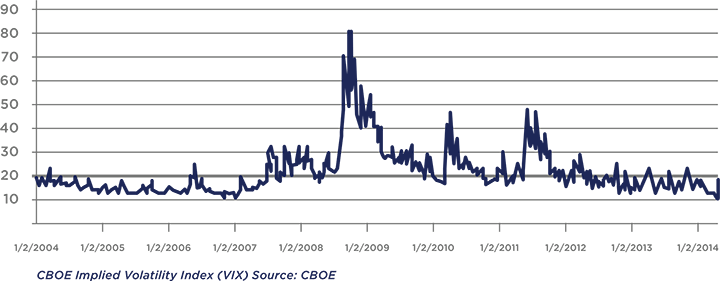
While it seems that volatility has reappeared with a vengeance as of late, in truth it is really only now approaching its long-term average level. Unfortunately the VIX index (pictured above) offers us little in terms of predictive quality. What we can see is that while volatility can remain low for long periods of time, changes occur often, and usually quite rapidly, over time. Chances are we won’t know exactly why or when the next sharp decline will arrive causing volatility to spike even higher. We don’t wish for market declines, but we are prepared for them.
PRINCIPLE THREE
VALUATIONS MATTER
Having said that it is impossible to time markets with pin point accuracy, the Vanguard study of 15 market indicators showed that two measures have the highest correlation with returns in the longer run (defined as the following 10 years). In second place came price-earnings, using trailing earnings for the previous year. The best predictor of future returns was also a price earnings measure, using earnings for the previous 10 years adjusted for inflation, an approach popularized by Yale’s Robert Shiller recipient of last year’s Nobel Prize for economics. It is intuitive that these two valuation metrics would have some predictive power in the long run as each is a measure of how much the market is charging today for a claim on future earnings. The more you pay now for future earnings, the lower your future returns are likely to be.
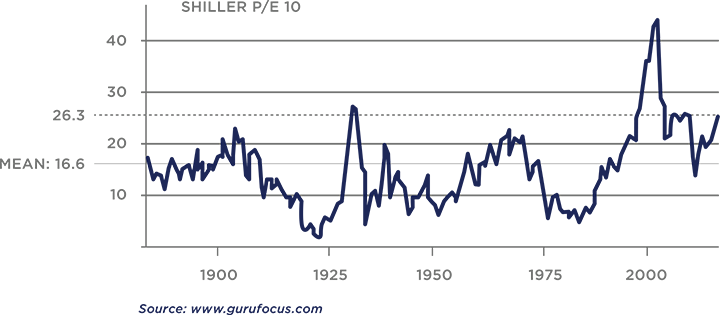
For the U.S. market, price-earnings multiples using earnings for the previous year are slightly elevated compared to their historical average. Using 10 years of earnings, as Robert Shiller suggests, the outcome is more concerning: At the end of September, the U.S. stock market was priced at 26 times average earnings for the past 10 years, more than 50% above the long term average of 16 times 10-year earnings. While this valuation does not approach the 44 times seen at the height of the tech bubble, it does suggest that in the next 10 years, returns on U.S. stocks will likely be lower than their historical average.
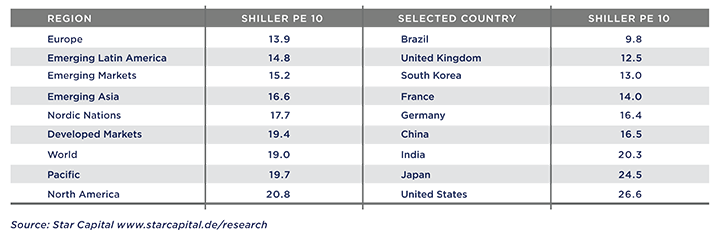
One response is to look outside the United States for stock markets that are more reasonably priced. In late August, Princeton’s Burton Malkiel wrote a Wall Street Journal article titled “Are Stock Prices Headed for a Fall?” In that article, he suggests that investors consider adding emerging-markets stocks to their portfolios. Those stocks’ valuations based on 10-year earnings are 40% below that of the U.S. market. Stocks in Europe and Japan also trade at lower levels than comparable U.S. companies.
WHAT THIS MEANS FOR YOUR PORTFOLIO
Our process is designed to manage market ups and downs as efficiently as possible and to leave our clients’ portfolios in the position to capitalize on opportunities that market swings create. Since we don’t claim to know what the future holds, the core of our portfolios are built with a diverse group of elements that are selected to thrive in varying market conditions. On the fringes, we use valuation metrics to try to find attractive assets and limit our exposures to expensive markets. While we almost always prefer inexpensive exposures to markets through index funds and ETFs, we are currently incorporating a handful of active strategies that have historically demonstrated solid risk adjusted returns and minimized drawdowns. We also have increased exposures to a few “alternative” investment strategies that simply seek to derive returns from sources other than stock market or interest rate exposure. We hope that these strategies will provide consistent positive returns that are not highly correlated to the stock or bond markets.
We have recently updated our website and invite you to take a quick look. In addition to the clean, fresh look, we have added some new content, as well as an easy access point at the top of every page to view client accounts at Pershing. Please let us know what you think.
As always, we thank you for the trust you have placed in us. We look forward to connecting with you as the year winds down, but please do not hesitate to call or write if there is anything on your mind.